The Art of Making Connections
Traditional data visualization often flattens complex histories into static, two-dimensional charts that tell a frozen story. But for an active arts incubator program like ours, a flat map just doesn’t cut it.
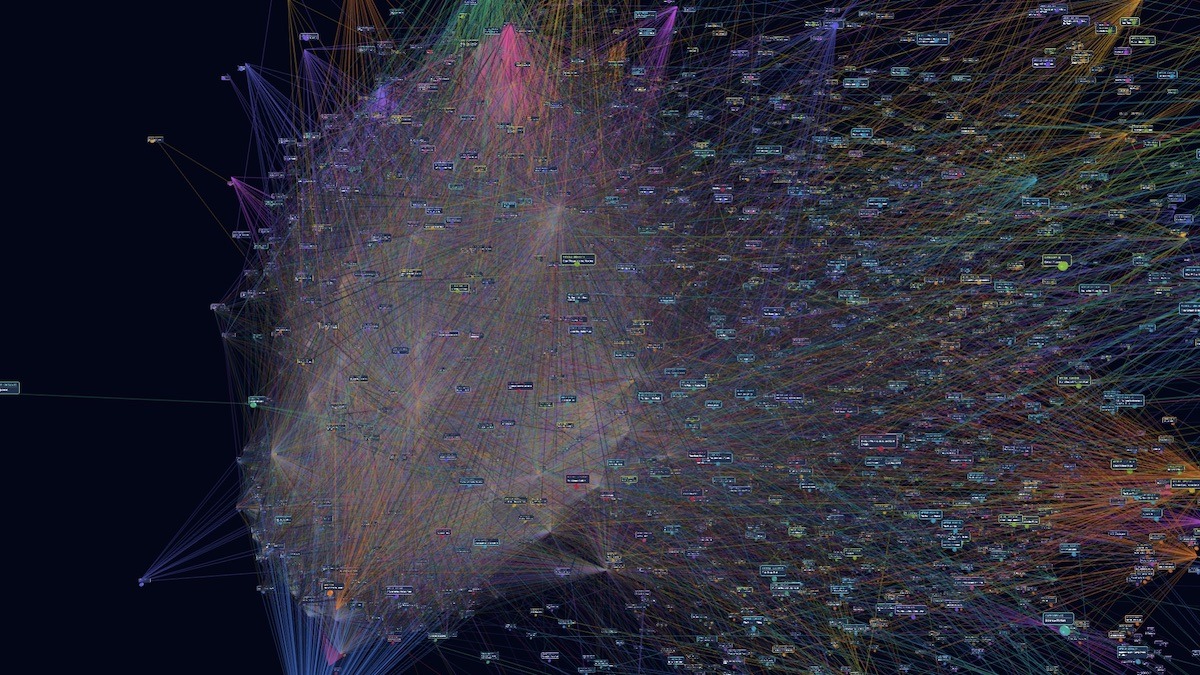
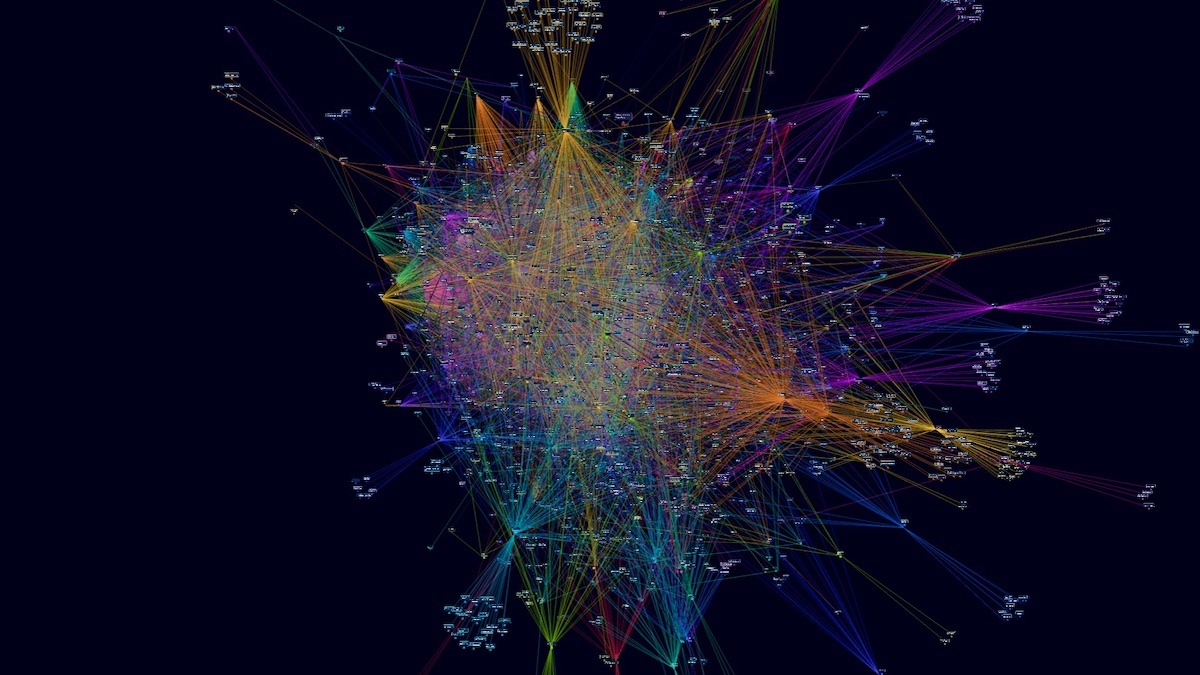
To map our growing ecosystem, we had some fun this weekend building a simple interactive knowledge graph. Unlike a traditional spreadsheet, a knowledge graph is a living web of relationships. In this digital space, individual data points represent things like community workshops, projects, people, places, and digital assets. The connecting lines trace collaborations, shared resources, ideas that move between projects, and the relationships and ripple effects that develop over time.
Part of the fun was realizing that we weren’t just learning another technical tool. We’re learning how to look at our own work differently. Building these graph means digging back through projects, events, photographs, posts, documents, and all the little pieces of activity that can otherwise disappear into folders and databases. It’s a creative deep dive into our history!
That made the project feel less like data management and more like an art project. We started noticing connections we hadn’t necessarily thought about before: how one workshop leads into another, how an idea travels between people and places, how a digital experiment becomes part of a community project, or how something small can eventually become part of a much larger body of work.
We also picked up some new skills along the way, learning more about graphing, mapping, data structures, and ways of making complex information interactive. But the technology is really just part of it. The interesting part is what happens when you use those tools to explore a creative ecosystem from the inside.
We’re still building it out, and it will keep changing as the work changes. That’s one of the reasons we like the format. It doesn’t pretend that have a neat beginning, middle, and end. It can keep growing with us.
We’ll be putting the interactive graph up on one of the screens during our next exhibition, so visitors can explore some of the connections for themselves. It will be a slightly different way of looking at what programs and projects actually produce—not just finished artworks or individual events, but a whole network of relationships, experiments, skills, people, places, and ideas that keep feeding into one another.