Data meets art: From 1,200-Page PDFs to Semantic Galaxies
Have you ever tried to read a 1,200-page federal impact assessment? It’s not just “dry”—it’s a geological event in paper form. Somewhere between page 400 and page 900, the vital connections between community concerns, Indigenous traditional knowledge, and technical engineering specs start to blur. In the world of the Impact Assessment Act, information is everywhere, but insight is often buried under a mountain of legalese.
That’s exactly why we built an Assessment Assistant. We’re not just digitizing documents; we’re mining the “semantic soul” of the project to turn massive PDFs into a living, breathing knowledge graph. And we sure did have fun with it!
The Magic of Semantic Network Graphs
In a standard database, data lives in boxes. A comment says one thing; a recommendation says another. But in a Semantic Network Graph, data lives in a web. Using advanced AI extraction, we scan every paragraph of those 1,200-page behemoths to find the “invisible threads.”
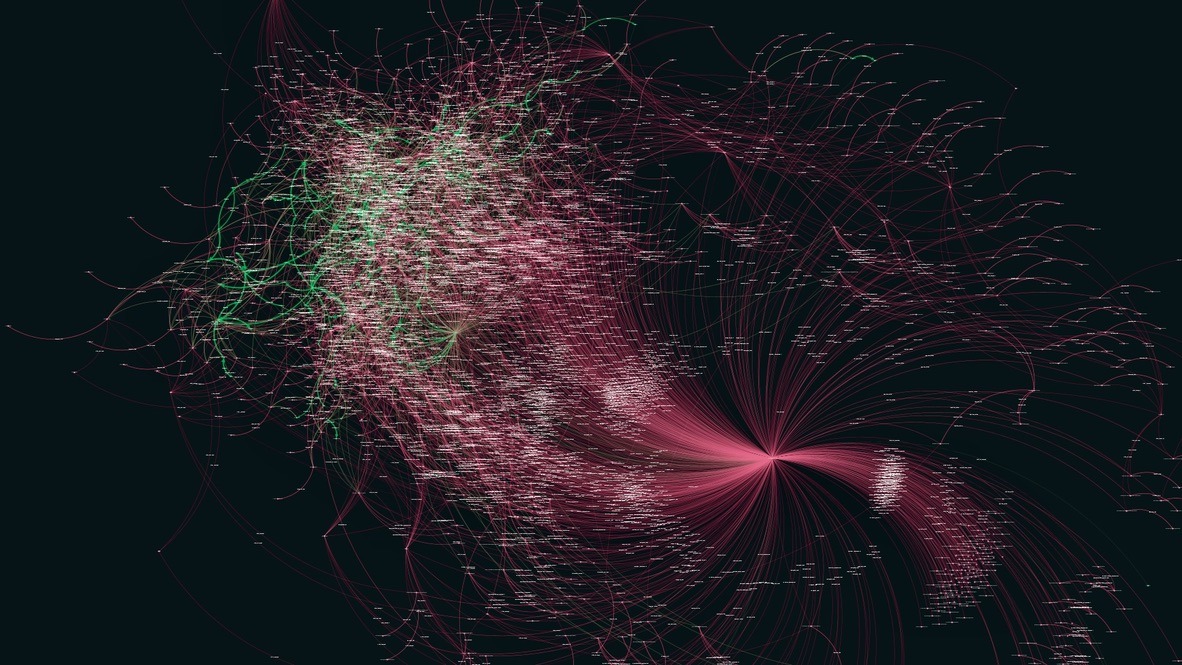
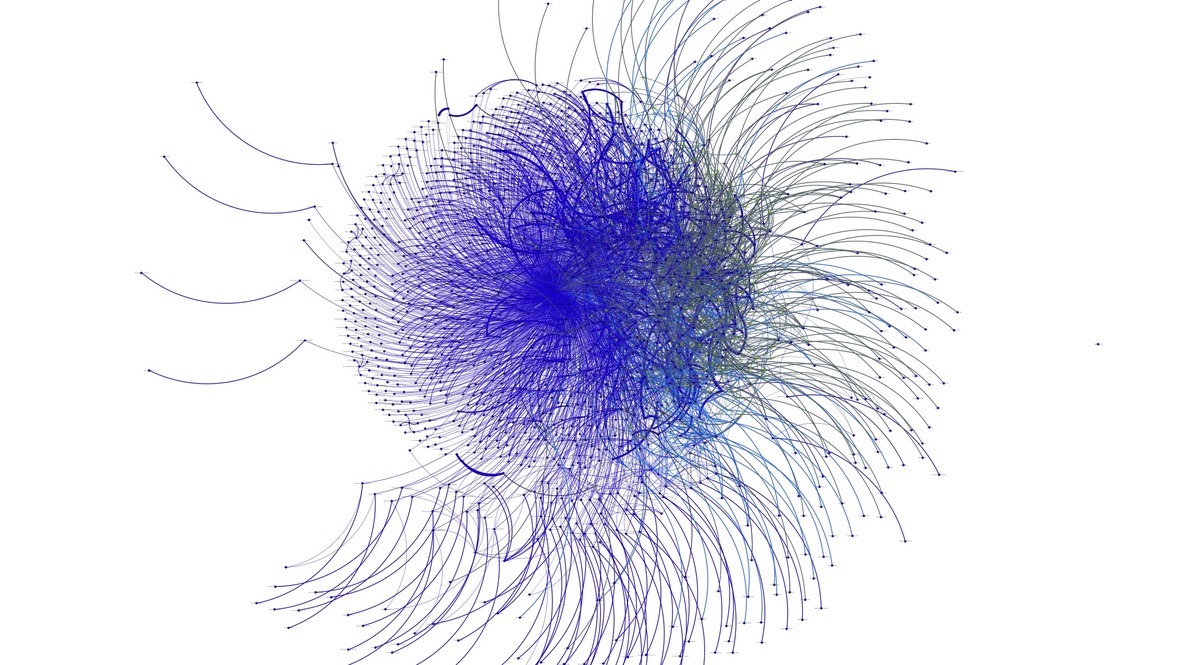
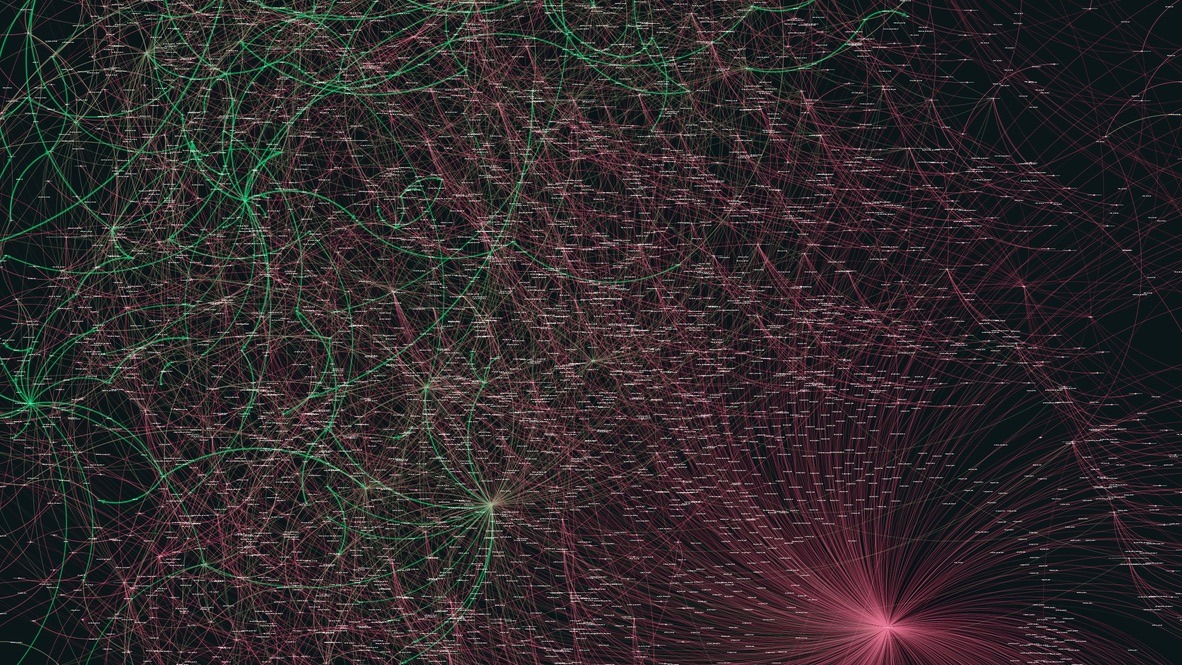
When a community member in Melgund mentions “Highway 17 safety” and a technical report discusses “borehole transport logistics,” the AI doesn’t just store two separate facts. It creates a link. It sees that the community’s bone-deep concern for safety is directly impacted by the project’s logistics. On your screen, this appears as a glowing galaxy of nodes—where the size of a bubble tells you how often a topic is discussed, and the thickness of the lines shows you how critical the relationship really is.
Beyond Sentiment: Visualizing the Community Pulse
It’s easy to say a comment is “negative” or “positive.” It’s much harder to visualize why. Our system goes deeper, categorizing feedback into specialized “hubs”—like Recreation, Water Quality, or Socio-Economic Impact.
Imagine opening a tool like Gephi and seeing a literal constellation of community voices. You can see how a single concern about “traditional harvesting” ripples out to touch environmental baseline studies and proposed legislative amendments. This isn’t just data visualization; it’s Empathetic Data Engineering. We are making sure that the human element of the Revell Site assessment isn’t lost in the technical noise.
Why the “Big Picture” Matters
The Impact Assessment Act is designed to look at the total effect of a project. But humans aren’t built to hold a few million words in their heads at once. By using AI to generate these comprehensive graphs, we allow regulators, working groups, and community leaders to:
- Spot “Information Gaps”: See where topics are isolated and need more research.
- Identify Conflict Points: See where community sentiment and technical plans are most at odds.
- Drill Down Instantly: Click a node in the graph and see exactly which page of the 1,200-page PDF it came from.
The Future is Connected
We are moving past the era of the “unreadable report.” In turning static tables into dynamic networks, we’re giving everyone a seat at the table—and a map to navigate it. Whether you’re an environmental scientist, a township official, or a concerned neighbor, the data is no longer a maze. It’s a message.

