New Tools, Growing Networks and Millions of Words of Code.
It’s been a busy start to the fall season. Between conferences, workshops, collaborations and projects stretching from Alberta and Manitoba to Northwestern Ontario, Quebec and Minnesota, we’ve had plenty happening across the network. Alongside the community programming and creative work, we’ve also been building, refining and publishing a growing collection of digital tools and experimental technologies.
Some of that work is visible in our latest projects. Some happens behind the scenes, in the infrastructure that helps us connect people, ideas, resources and creative work across different locations.
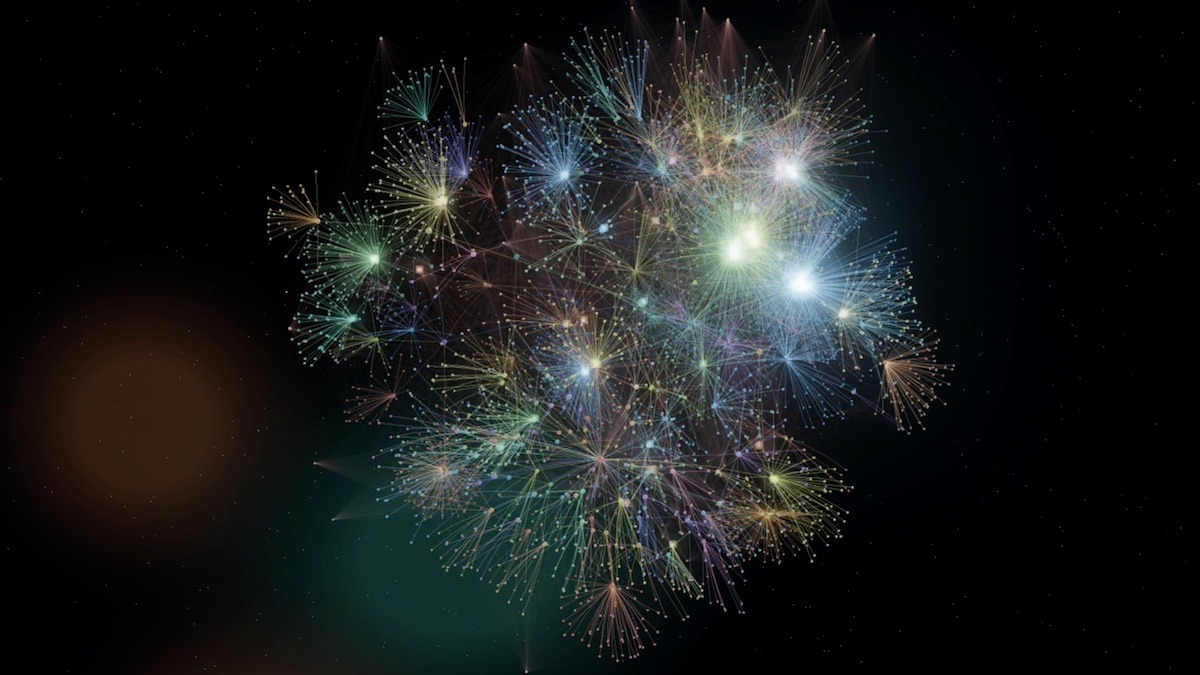
Over the past several months, we’ve had fun experimenting with a number of practical digital tools. Our Visual Graph 3D Time-Lapse project has been a particularly interesting development. It connects live website and database information to an interactive three-dimensional network, making relationships between projects, organizations, activities, workshops and outcomes easier to see. The network is designed to grow and change over time, allowing us to examine how ideas connect, how projects develop and where new relationships emerge.
We’ve also been working on browser-based media tools, including an Audio Converter that handles WAV, MP3 and M4A files, with support for metadata and artwork. The tool is designed to process files directly in the browser, without requiring them to be uploaded to an external service.
Other developments include image-editing tools, interactive games, digital storytelling applications and improvements to our publishing and static-site generation systems. We’ve continued experimenting with local text-to-speech technologies and ways to make our digital infrastructure more useful, efficient and accessible.
We’ve also been cleaning up and updating. The scale of some of this technical work has grown considerably. Across our wider ecosystem, we’ve now cleaned, organized and processed more than 35 million words of code. This includes substantial work on our digital storytelling projects, custom applications, publishing systems, databases and supporting infrastructure. One of the more interesting aspects of this work is seeing how allthe different pieces fit together.
Network graphs help visualize an increasingly interconnected body of work, showing how organizations, people, projects, tools and activities relate to one another. We’re interested in more than simply documenting what’s been happening. The aim is to make connections visible, recognize emerging opportunities and better understand how community-based creative activity develops over time.
This work also supports our broader interest in community infrastructure: the relationships, resources, knowledge and practical capabilities that make sustained creative activity possible.
It’s been a particularly active period for our community-based work, with plenty of experimentation happening alongside more established programming. We’re behind catching up on a few things, and we know we need to connect with more than a few people and organizations that have reached out!