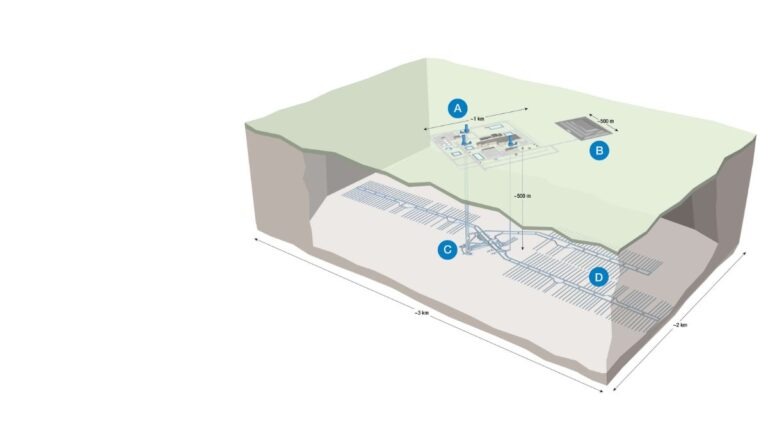

Based on the strong upward momentum observed since early 2025, the site is projected to reach approximately 2.82 million total visits by the end of 2026. This trajectory, illustrated by the dashed forecast line, represents a significant 165% increase over the previous year's estimated traffic, driven by a consistent month-over-month growth trend that accelerated in late 2025.
Annual Server Performance & Growth Report
Period: January 2025 – January 2026
Scope: Main Arts Incubator Server (All Projects)
Executive Summary: A Year of Transformation
The server data from January 2025 to January 2026 reveals a transformative year for the Arts Incubator digital infrastructure. The server has evolved from hosting low-traffic utility projects to supporting a high-volume, media-rich content ecosystem.
Key Headline: Year-over-Year (YoY) monthly traffic has increased by 582%, growing from roughly 24,000 visits in January 2025 to over 166,000 visits in January 2026.
1. Year-Over-Year Growth Comparison (Jan ’25 vs. Jan ’26)
The most striking metric is the comparison between the start and end of this 13-month period. The baseline for what constitutes a “normal month” has shifted dramatically.
| Metric | January 2025 | January 2026 | Growth Factor |
| Total Visits | 24,331 | 166,140 | 6.8x (Increase) |
| Total Hits | 413,329 | 1,035,268 | 2.5x (Increase) |
| Bandwidth | 8.6 GB | 85.5 GB | 9.9x (Increase) |
Analysis:
- Visits vs. Hits: Visits grew significantly faster than hits. This suggests that in early 2025, the server likely hosted asset-heavy pages or automated scripts (high hits, fewer users). By 2026, the traffic represents genuine human engagement—users staying longer and exploring distinct projects.
- Bandwidth Explosion: The nearly 10x increase in bandwidth usage confirms the shift towards rich media applications (images, generated content, and interactive storytelling) compared to the text-based or static content hosted in early 2025.
2. The Three Phases of 2025
Phase 1: Steady Baseline (Jan – Aug 2025)
- Average Monthly Visits: ~50,000
- During the first half of the year, the server showed healthy but modest organic growth. Traffic peaked in June (75k visits) likely due to summer programming or specific arts initiatives, before settling back down in August (64k visits). This was the server’s “pre-viral” state.
Phase 2: The Catalyst (September 2025)
- Visits: 100,045 (+55% from previous month)
- The activation of the storytelling projects in September marks the definitive inflection point in the data. This was the first month the server broke the 100k visit barrier. It signaled that the new interactive projects were not just add-ons, but primary drivers of traffic.
Phase 3: The Surge (Oct – Dec 2025)
- Peak Visits: 195,955 (December)
- Q4 2025 demonstrated exponential adoption. November saw a 42% jump over October, and December nearly doubled the traffic of September. The server effectively handled a load triple that of its Q1 average, proving infrastructure resilience during high-demand periods.
3. Current Server Health & Trajectory
- High Retention Floor: While January 2026 saw a natural post-holiday dip from December, it did not crash back to pre-launch levels. Maintaining 166k visits in January proves that the audience acquired in Q4 is sticky.
- Daily Load: The server is now managing an average of 6,645 visits per day. In comparison, a year ago (Jan ’25), it was managing roughly 1,000 visits per day.
- Resource Demand: The consistent bandwidth usage (staying near or above 85GB/month) indicates that the server is now permanently functioning as a media delivery hub.
Conclusion
The Arts Incubator server has successfully graduated from a small-scale host to a major digital venue. The storytelling projects launched in September were the primary engine of this growth, permanently lifting the platform’s visibility. The data suggests a highly successful year of digital outreach, with 2026 starting at a performance tier significantly higher than any point in the previous history of the server.