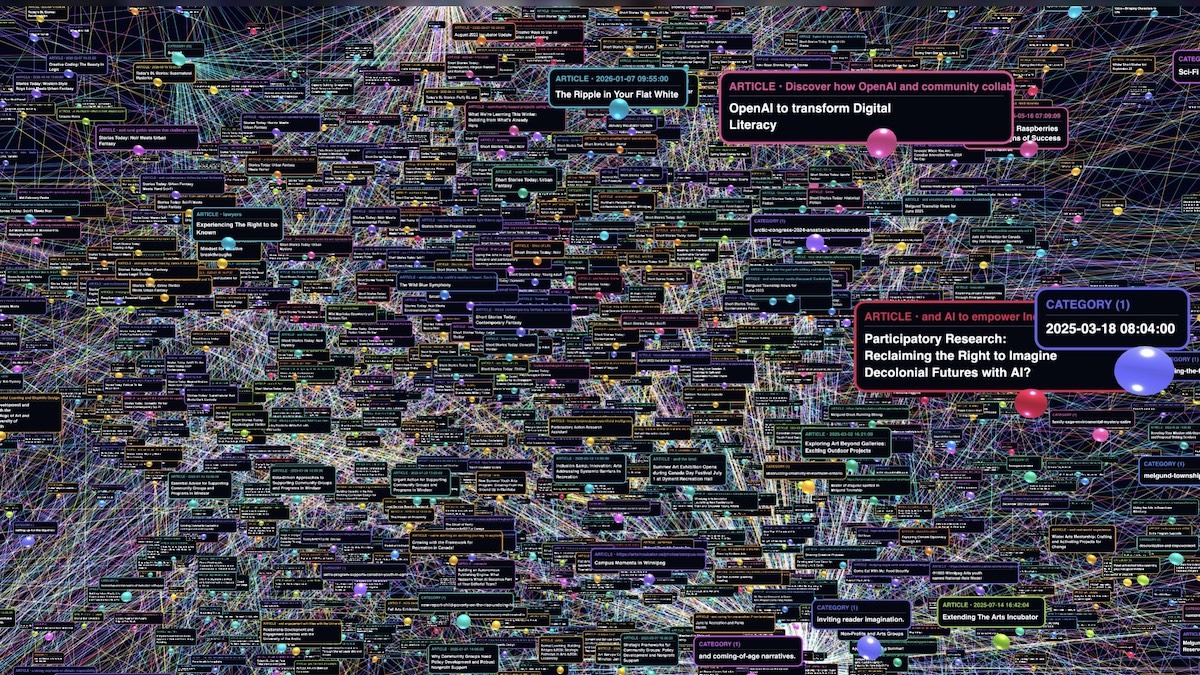
From Raw Data to Knowledge Graph: Visualizing the Hidden Relationships in Complex Work
Organizations produce enormous amounts of digital content: articles, reports, project logs, photographs, meeting notes, and records of completed activities. Over time, that material spreads across websites, databases, and file directories. Finding an individual record may be straightforward. Understanding how thousands of records relate to one another is much harder.
We’ve been having fun developing an interactive 3D time-lapse graph to address that problem. It connects millions of words and thousands of records across digital archives, turning them into a navigable map of an organization’s work. Instead of searching for documents one at a time, users can examine relationships between projects, trace activities through time, and see connections that are difficult to recognize in a conventional database.
The system has two practical uses: documenting work for funders and other stakeholders, and helping teams make better use of their own accumulated knowledge. It’s also fun because we love graphs and visuals.
Making Project Evidence Easier to Verify
Funding reports require organizations to account for what they have done, how activities relate to program objectives, and what resources have produced. Written reports are necessary, but summaries can obscure the volume and interconnectedness of the underlying work.
A knowledge graph provides another way to examine the evidence.
Each article, activity, photograph, project record, or deliverable can appear as a node, connected to related records through project associations, categories, tags, and shared content. A user can start with a program objective and follow its connections to the activities and records that document the work.
The time-lapse view adds chronology. Users can see when activities entered the record, how projects developed, and where separate streams of work began to overlap. Individual nodes lead back to their source material, allowing the underlying documentation to be examined.
This makes it easier to substantiate a project report and identify the records supporting a particular claim. Rather than presenting accomplishments solely through a written summary, an organization can show how its documented activities fit together and relate to its commitments.
Finding Work That Has Been Overlooked
The same system is useful for internal research and analysis. In a large archive, important work can become difficult to retrieve simply because it happened years ago, was recorded on another platform, or used terminology that no longer appears in current projects.
A conventional search retrieves records matching a query. A knowledge graph also provides a way to follow relationships between records. Shared keywords, tags, categories, textual similarities, and timestamps can help identify related material. As the network takes shape, clusters of activity become visible, along with connections between projects that might otherwise be treated as separate.
This can help answer questions that are difficult to resolve through ordinary file searches. Which earlier activities contributed to a current initiative? Where have similar ideas appeared in different projects? Are there gaps in the documentation? What work exists in the archive that the team has simply stopped referring to?
These are practical questions about organizational memory. Their answers can affect how teams understand their history, plan future activities, and recognize the value of work already completed.
How our 3D Graph Works
The visualization combines a network data model, automated spatial layout, and browser-based 3D rendering.
Network structure. Each record is represented as a node. Connections are established through known associations and shared characteristics, including project membership, tags, categories, and content similarity. Network analysis can identify highly connected records that link multiple activities or themes.
Spatial clustering. Force-directed algorithms arrange nodes according to their relationships. Connected records tend to move closer together, while repulsive forces maintain space between them. The resulting clusters provide a visual guide to the structure of the archive. As records and connections change, the layout can be recalculated.
Time-based navigation. Timestamps allow users to move through the archive chronologically. The graph can show how documented activity accumulates and how different projects develop over time. Users can pause at a particular period, inspect a cluster, and follow its connections to individual records.
Interactive rendering. GPU-accelerated graphics allow the browser to draw and manipulate large numbers of nodes and connecting lines. Users can rotate the graph, zoom into particular areas, search for records, and move between individual items and the wider network. Performance depends on network size, rendering methods, and available hardware.
These elements work together to make a large archive easier to navigate without reducing it to a flat list of search results.
A Working Memory for Long-Term Projects
The value of this approach lies in the relationships it preserves and exposes. An article published several years ago may document the origins of a current project. A photograph may provide evidence of an activity described elsewhere. A series of small tasks may reveal a sustained effort that is difficult to recognize when each task is viewed in isolation.
When these records remain disconnected, reconstructing that history takes time and often depends on the people who remember it. A knowledge graph gives the organization another way to recover that context. It also makes the archive useful for more than retrospective reporting. Teams can investigate connections, locate supporting material, identify missing documentation, and develop a clearer picture of how their activities relate across projects and over time.
The underlying records remain essential. The graph provides a way to work with them collectively, revealing relationships that are otherwise easy to miss. For organizations managing years of projects and large digital archives, that changes how historical information can be used. The record of past work becomes a resource for understanding current activity, demonstrating what has been accomplished, and informing what happens next.
And like we said. It’s also a lot of fun.